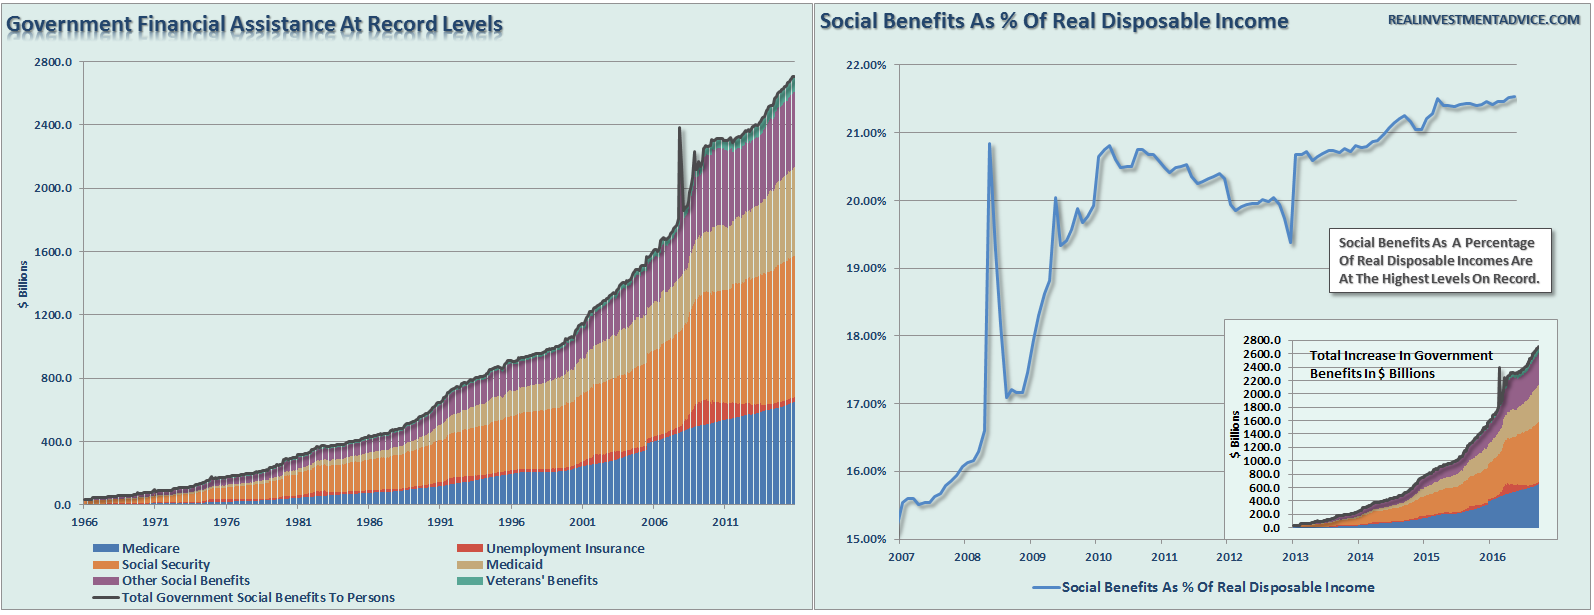
Because the main street economy is failing, the nation’s entitlement rolls have exploded. About 110 million citizens now receive some form of means tested benefits. When social security is included, more than 160 million citizens get checks from Washington.
The total cost is now $3 trillion per year and rising rapidly. America’s entitlements sector, in fact, is the sixth biggest economy in the world.
Yet in a society that is rapidly aging to the tune of 10,000 baby boom retirees per day, this 50% dependency ratio is not even remotely sustainable. As we show in a later chapter, social security itself will be bankrupt within 10 years.
Still, there is another even more important aspect of the mainstream narrative’s absolute radio silence about the monumental entitlements problem. Like in the case of the nation’s 30-year LBO, the transfer payments crisis is obfuscated by the economic blind spots of our Keynesian central banking regime.
Greenspan, Bernanke, Yellen and their posse of paint-by-the-numbers economic plumbers have deified the great aggregates of consumer, business and government spending as the motor force of economic life. As more fully deconstructed below, however, this boils down to a primitive notion of bathtub economics.
In this bogus economic model, it is assumed that the supply-side of the economy is always fully endowed or even over-provided. By contrast, the perennial problem is purportedly a shortfall of an ether called “aggregate demand”.
So the job of the central bank is to pump reserves and credit into the macroeconomy until the resulting incremental spending by households, business and government has caused “full employment GDP” to be filled to the brim. In effect, spending derived from current production and income is supplemented with proceeds extracted from increasingly indebted balance sheets.
Needless to say, this amounts to borrowing from future production and income, but it does boost the current period GDP so long as there is still runway available on household and business balance sheets. Yet what we call the Keynesian parlor trick—-goosing current economic output by leveraging-up balance sheets—–self-evidently doesn’t work in an economy that is at Peak Debt, as we document in the next section.
There is a similar story when government borrowing is used to fund transfer payments. Overwhelmingly, transfer payment recipients live hand-to-mouth—-so virtually 100% of the proceeds go into the spending stream (PCE) with little leakage or lag.
By contrast,, it’s an altogether different matter when transfer payments are funded out of current taxation. That’s purely a zero-sum game in which income producers have less to spend or save and recipients have more.
So the policy elite’s vestigial Keynesian fetish about “aggregate demand” means that ideas of quality, sustainability, efficiency, discipline, prudence or, for that matter, even economic justice and equity, never enter the narrative. Likewise, the possibility that current spending bloated by debt and transfer payments isn’t sustainable has simply been defined out of existence.
It matters not a whit to the Keynesian policymakers, for example, whether the considerable expansion of household consumption spending (PCE) depicted below originated in disability checks, second mortgages or car loans at 120% loan-to-value. All spending is good, apparently, even if it was deposited by a passing comet.
What counts is the incremental gains in GDP compared to last quarter and in proxies for demand such as job counts and housing starts versus prior month. That’s what fuels bullish spasms in the Wall Street casino. And when the business cycle eventually ends, there is always a scape-goat to blame, such as an oil price shock or a financial market meltdown.
The graph below depicts how the establishment’s “growth” swindle actually works. There are currently 126 million prime working age persons in the US between 25 and 54 years of age. That’s up from 121 million at the beginning of 2000
Yet even as the current business cycle is rolling over, the 77.1 million persons employed full-time from that pool is still 1.2 million below its turn of the century level!
That’s right. Only 61% of the prime working age population has full-time jobs. That compares to 65% as recently as the year 2000.
So it might be wondered. How is it possible that real consumption expenditures rose by a whopping $3.1 trillion or 38% during the same 16-year period that the number of full-time prime age workers was actually dropping?
Yes, the employment shown in the chart below is supplemented by part time workers, where the ranks have grown modestly, and also by the steadily rising participation rate of Wal-Mart greeters among the over 65 cohort. But the fact remains that on the margin the 38% real gain in consumer spending since the year 2000 shown below was funded from sources other than pay envelopes.
spending since the year 2000 shown below was funded from sources other than pay envelopes.
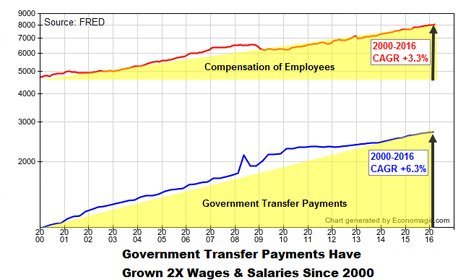
Among the alternative sources which played a major role in funding the nation’s shopping cart, of course, was the explosion of government transfer payment. In fact, during the last 16 years government transfer payments have grown at 6.2% annually or by nearly 2X the 3.3% growth of nominal wage and salary disbursements.
Accordingly, as shown in the chart below, transfer payments soared by $1.7 trillion during the period. This means the gain in transfer payments amounted to nearly 50% of the entire gain in wage and salary disbursements to the nation 150 million employed persons.
Needless to say, that astonishing and unsustainable trend have been completely ignored by the Wall Street/Washington peddlers of consumption based economics.
The Fed has never once mentioned the rapidly deteriorating quality of household income and spending during the last 15 years. And in crowing about all the part-time and “born again” jobs it has purportedly created, the Obama White House has never remotely acknowledged that its vaunted “recovery” has been largely built on transfer payments and debt.
So “deterioration” is not an inappropriate word. As a matter of public policy, $2.7 trillion per year of transfer payments may represent a bargain that society has chosen to make for reasons of equity and social welfare. But that doesn’t gainsay the fact that the underlying economics are an altogether different matter.
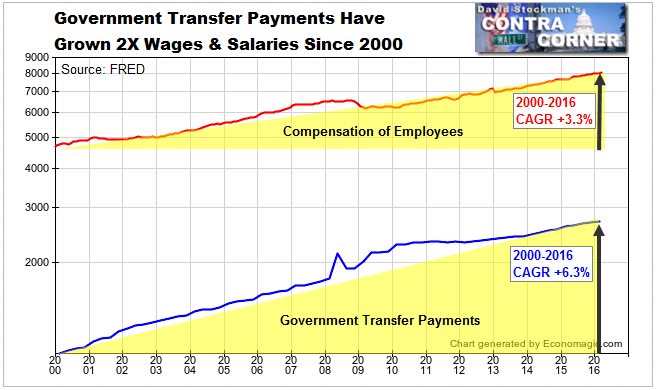
To wit, in May 2016 total transfer payments amounted to fully one-third of all the wage and salaries disbursed to the entire work force of the United States. And if you grant the old-fashioned assumption the government salaries are funded by taxation rather than production, then transfers amount to nearly 40% of wage and salary disbursements to private sectors employees.
So let’s put the chart below in plain english. Sixteen years is not a blip; it’s an embedded trend. When the transfer payment flows to “takers” over that span have fast approached the earnings of “producers”, you have a system that will, at length, go tilt.
This article appeared at ZeroHedge.com at: http://www.zerohedge.com/news/2016-07-30/us-government-entitlements-sixth-biggest-economy-earth

:quality(75)/https://static.texastribune.org/media/files/ac4663e79b416628097ea59744969877/0418%20RGC%20Drought%20BL%20TT%2005.jpg?resize=440,264 "South Texas Farmers Are In Peril As The Rio Grande Valley Runs Dry — Again")


